12:51
Info-graphics Chart Series: Video - 1
PK: An Excel Expert
15:10
Info-graphics Chart Series: Video - 2
13:03
Info-graphics Chart Series: Video - 3
12:13
Info-graphics: Construction Projects Completion Status chart
11:38
Info-graphics: Iceberg Chart in Excel
13:30
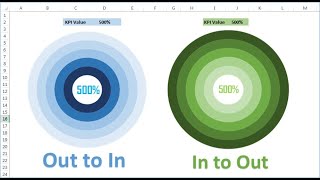
3D Doughnut Chart for KPI Metrics
11:05
Yesterday Vs Today Sales Chart in Excel
15:58
RAG Condition Formatting in Progress Circle chart in Excel
14:23
Stunning Battery Chart in Excel
11:16
Dynamic Step chart in Excel
14:11
Multilayered Doughnut Chart : Part-1
8:10
Multilayered Doughnut Chart : Part-2
11:44
Stylish Doughnut Chart in Excel
13:29
Conditional Formatting in Stylish Doughnut Chart
14:19
Employee Wise Deficit and Surplus Sales Chart
12:53
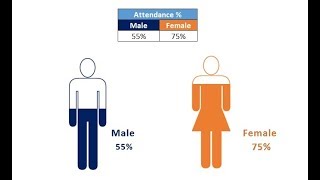
Male and Female Info-graphics in Excel
10:36
Chart Templates in Excel
14:33
Info-graphics with Line Chart
Info-graphics with Column Chart (Part-1)
12:16
Info-graphics in Column Chart (Part-2)
8:11
Info-graphics: Filling Stacked Column Chart in Excel
12:14
Info-graphics: 3D KPI Indicator in Excel
10:57
A Stunning Circular Chart for KPI Metrics
5:58
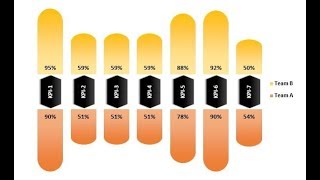
An Innovative chart for team level performance
13:22
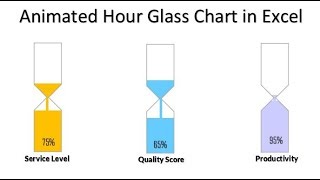
Info-graphics: Animated Hour Glass Chart in Excel
12:22
Highlight the Specific data point in a Line Chart Dynamically
7:53
Conditional Formatting in Line Chart
10:02
Info-graphics: Slide Meter Chart (Version-1)
10:34
Info-graphics: Slide Meter Chart (Version-2)
12:33
Info-graphics: Slider Meter Chart (Version-3)
12:32
VBA: Dynamic Charts in User Form
10:53
Innovation: Focus Chart in Excel
10:03
Informative KPI Indicator Chart (Version-1)
9:17
Informative KPI Indicator (Version-2)
10:39
Stylish Butterfly Chart (Version-1)
8:07
Stylish Butterfly Chart (Version-2)
15:32
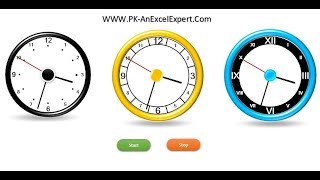
Innovation: Analog Clock in Excel (Pie + Doughnut Chart)
7:36
Info-graphics: Flag Chart in Excel
10:15
Info-graphics: 3D Glass Chart in Excel
10:29
Info-graphics: Conditional Formatting in Lollipop Chart || Learn 4 different Variants of this Chart
8:13
Innovation: Fish Chart in Excel
8:01
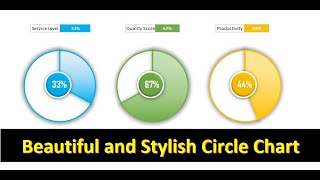
Info-graphics: Beautiful and Stylish Circle Chart in Excel
8:40
Small Charts for Weekly Performance || Useful Charts for Excel Dashboard
10:20
Info-graphics: Stunning Thermometer Chart in Excel
1:21
Our World Class Charts, Dashboards and Excel Tips and Tricks
4:04
3D Disk Pie Chart in Excel || Learn in less than 5 Minutes
10:05
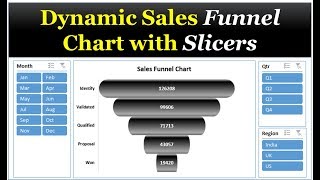
Dynamic Sales Funnel Chart with Slicers
8:47
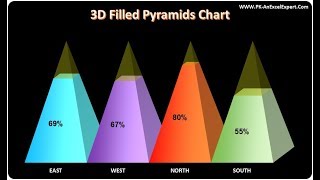
3D Filled Pyramids Chart in Excel
14:24
3D Container Pivot Chart with Slicers and Timeline
7:58
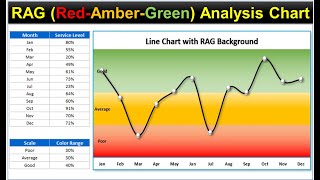
RAG (Red-Amber-Green) Analysis Chart in Excel || Line Chart with RAG Background
12:26
Stylish Pivot Chart with Slicer in Excel
12:37
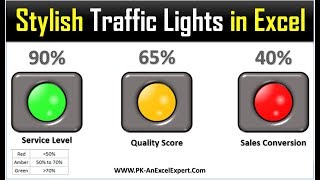
Info-graphics: Stylish Traffic Lights in Excel
11:12
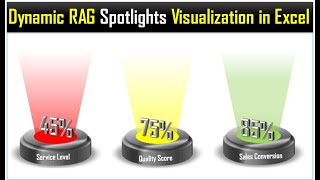
Spotlight Visualization in Excel (Part-2) | Highlight your top performer with Spotlight
15:11
Spotlight Visualization in Excel (Part-1) | Dynamic RAG (Red, Amber, and Green) Stoplights
10:50
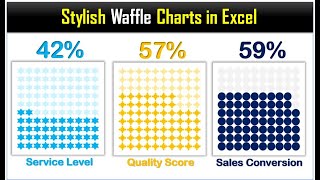
Stylish Waffle Charts in Excel Without Macro
9:23
Vertical Timeline Chart using Scatter chart in Excel
6:52
Horizontal Timeline Chart using Scatter chart in Excel
13:54
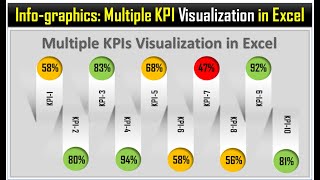
Info-graphics: Multiple KPIs Visualization in Excel
12:06
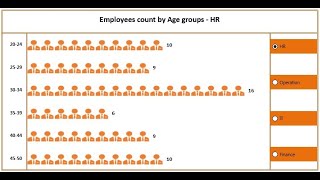
Dynamic Chart with Slicer for Employees Count by Age group
10:06
Dynamic Chart with Option Button for Employees Count by Age group
9:45
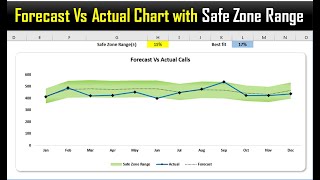
Forecast Vs Actual Chart with Safe Zone Range in Excel
15:55
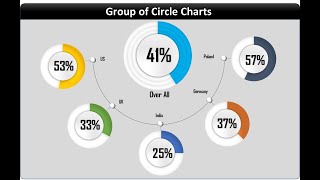
Info-graphics: Group of Circle Charts in Excel
18:49
Dynamic Variance Arrows Chart with Check Boxes
8:14
Part-2: Dynamic Variance Arrows Chart with Slicers
14:01
Animated Speedometer Chart in Excel
11:22
Info-graphics: Timer Chart Visualization in Excel
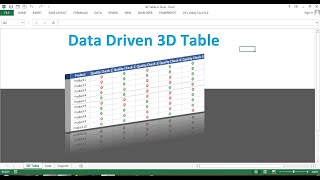
Info-graphics: Data Driven 3D Table in Excel
13:06
Dynamic Performance Chart in Excel
17:53
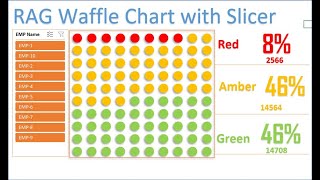
RAG waffle Chart visualization with Slicer
12:08
5 Layered Advanced Doughnut Chart
19:13
Beautiful 3D Visualization in Excel
16:13
Medical Science Info-graphic Chart in Excel
21:18
Info-graphics: RAG Conditional Formatting in 3D Chart
15:41
Info-graphics: 3D Gauge Chart in Excel
21:52
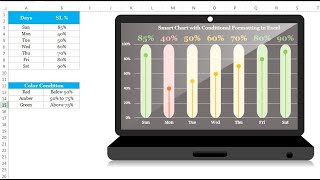
Info-graphics: Smart Chart with Laptop Shape in Excel
23:04
Stylish and Dynamic Comparison Chart | No Excel Shape or Picture used
25:49
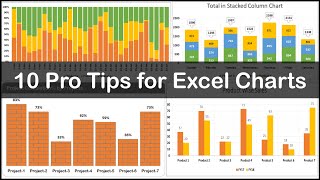
10 Pro Tips for Excel Charts
19:17
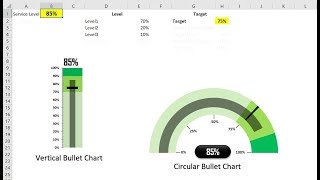
Vertical and Circular Bullet Chart in Excel
3D Chart for Weekly Sale in Excel
10:10
Stylish Column Chart in Excel
10:26
Dynamic Circle Chart in Excel
11:11
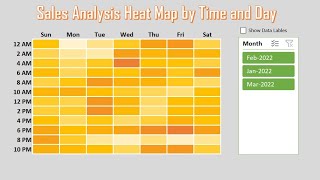
Sales Analysis Heat Map by Time and Day
Multi-color Data bar with REPT function in Excel
15:12
Quick 3D Container Chart in Excel
11:58
Use of Symbols and Emojis in Excel Drop-down List and Excel Charts
7:57
Dynamically Highlight Topper Student on the Chart in Excel
7:26
An Effective Stacked Column Chart with Integrated Totals
8:53
Mind-Blowing Excel Hack: 3D Waffle Charts in Just Steps
6:26
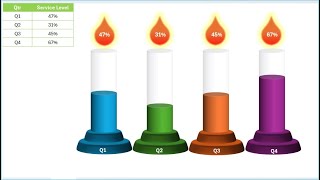
How to WOW Your Boss: 3D Progress Circle in Excel 🚀
8:12
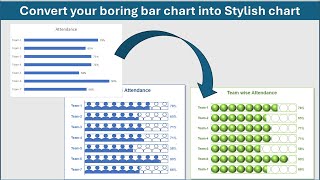
Convert your boring bar chart into Stylish charts
9:37
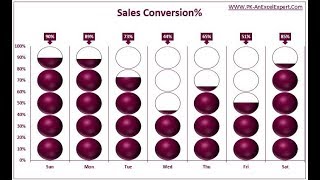
Candle info-graphics chart in Excel | Step by step tutorial
5:43
Sales Funnel info graphics in Excel | Step by step tutorial
10:16
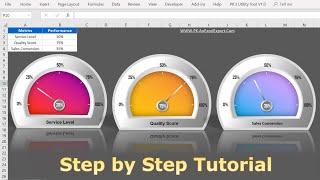
Credit Rating Meter Chart in Excel | | Step by Step Tutorial
20:06
Pro Gantt Chart in Excel with Data Entry Form || Complete Tutorial
10:07
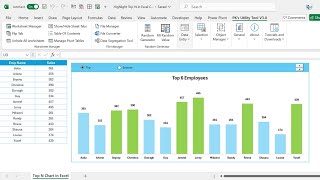
Highlight Top and Bottom N in Excel Chart | Step by Step tutorial
6:41
Stylish Progress Bar Chart in Excel | Step by Step tutorial
6:18
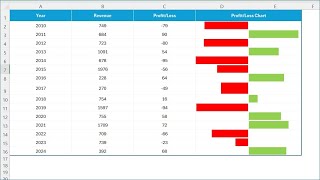
Profit and Loss Chart in Excel | Step by Step tutorial