12:12
R installation, basics of R programming, mathematical operators
Rajendra Choure
29:53
R data types and vectors:Tutorial Learning R Part 3 of 8
13:43
Publication ready graphs on android mobile phone' ggplot2 on R programming compiler, scatter plot
21:57
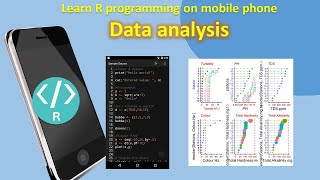
Data anlaysis and data visulisation using R programming on Mobile phone
17:32
Hypothesis testing -t-test two sample :normal distribution and Shapiro's test
16:23
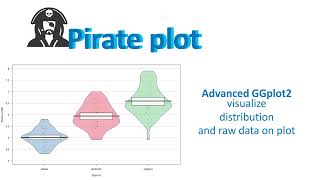
Violin plot Tutorial 1-Data Visualization using R and GGplot2, plotting data distribution
18:00
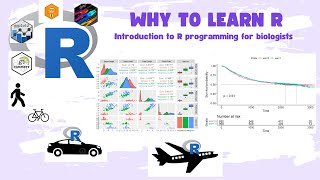
Why learn R programming: demonstration of the strength of R simulating enzyme kinetics
Tutorial data analysis on smartphone: Corona data analysis on smart phone
4:58
R data visualisation : Boxplot using R and GGplot2, plotting data distribution
14:56
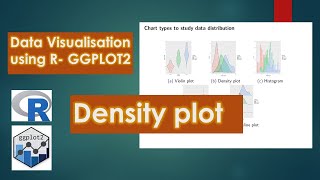
Tutorial 2-Density plot Data Visualization using R and GGplot2, plotting data distribution
10:18
Tutorial 3 Histogram Data Visualization using R and GGplot2, plotting data distribution
7:55
Tutorial 5-Ridgelines Data Visualization using R and GGplot2, plotting data distribution
7:35
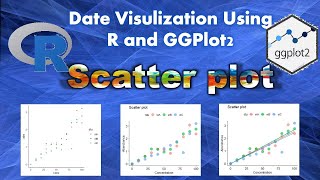
Tutorial 6-Scatter Plot Data Visualization using R and GGplot2, plotting Correlation
8:05
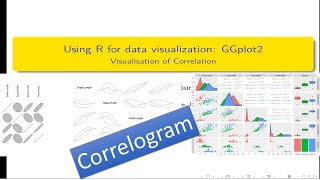
Tutorial 7-Correlogram Data Visualization using R and GGplot2, plotting Correlation
3:13
Bubbleplot and connected scatter Data Visualization using R , GGplot2, plottiCorrelation
7:27
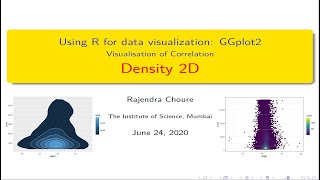
Tutorial 9-Density 2D Plot, Data Visualization using R , GGplot2, Plotting data correlation
7:40
heatmap in R: Tutorial 10-Heatmap, Data Visualization using R , GGplot2, data correlation
22:31
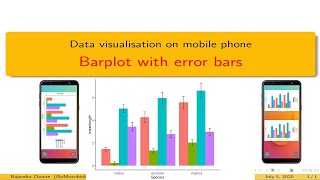
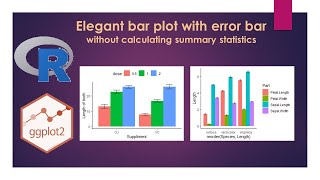
Barplot using R with error bar, Data Visualization, GGplot2, Plotting data ranking
13:09
R on mobile Phone: Bar Plot with error bars on mobile phone
11:06
Tutorial R for research: Single factor experiment Design and analysis using R programming
11:08
Tutorial R for research: Randomised complete block design
9:24
Lollipop Plot Data Visualization using R , plotting performance data
5:22
Circular bar Plot Data Visualization using R , plotting performance data
8:26
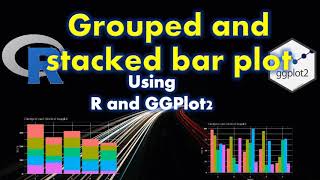
Barplot stacked -grouped Barplot , Data Visualization using R , GGplot2, Plotting part of whole
10:09
customsing the plot text elements Data Visualization using R , GGplot2, P
7:59
Plot in R :Adding data labels to R plots, Data Visualization using R , GGplot2, P
8:13
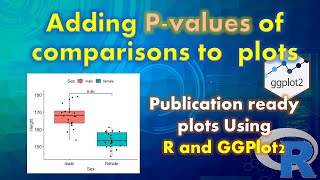
How to add p-values of statistical significance on graphs
10:07
Scatter Plot in R again, Data Visualization using R and GGplot2, plotting Correlation
15:15
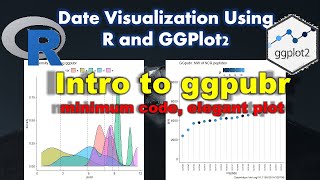
GGpubr advanced Publication ready graphs using R
5:17
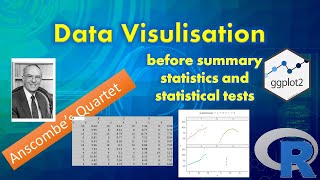
Anscombe's quartet, A case for Data visulisation-Plot before analysis1
4:33
Bargraph in R , Arrange bars of barplot using R and GGplot2
10:45
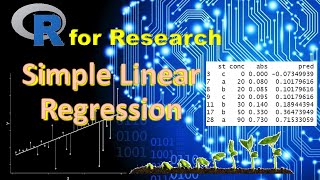
Simple linear regression and prediction in R ,with validation of model
2:42
Data import for R programming on android phone: Import CSV file for r compiler
11:37
Customize Bar plot in R -GGplot2- in 5 steps : Beautiful publication ready bar plot
22:00
Machine Learning in R with caret : A tutorial for building and validating statistical models
6:10
R programming Export data R to excel and word
9:39
plot with gapped( discontinuous) y axis: using GG.gap and plotrix package
7:49
ggplot- patch many plots together: how to put many subplots together and annotate those
28:54
Introduction to ggplot2: learn to plot beautiful graphs. Nice lollipop chart
15:30
Introdcution to ggplot2: plot nice graphs using grammar of graphics in r programming
9:40
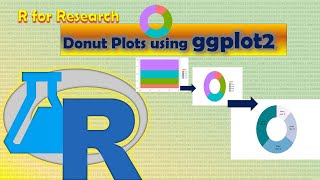
donut chart using R and ggplot2
9:53
R programming at work: Simulate equations
3:25
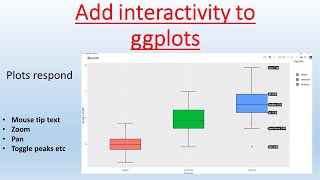
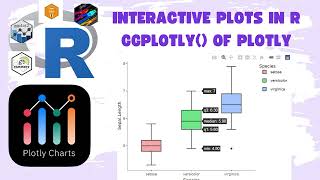
R programming: Interactive plots with ggplotly
7:18
R programming at work: Shiny to make plots into interactive dashboard apps
4:46
R programming at work: Interactive plots using ggplotly, customise tooltip text
12:10
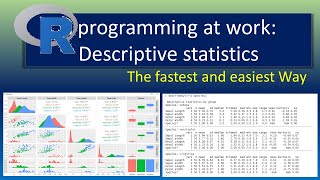
Descriptive statistics using R and its packages: automating computaion of mean,sd, variance etc
6:40
t-test: Hypothesis testing One sample t test
12:16
R programming at work: How to perform ANOVA analysis of variance Hypothesis testing
16:37
Learn R programming on mobile phone :data types
8:30
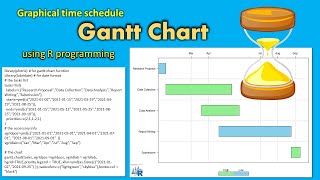
How to make Gantt chart in R?
2:52:27
Statistical modelling of data using R One Day Workshop
7:43
rmarkdown: Convert R script to report in html, pdf or word format
7:14
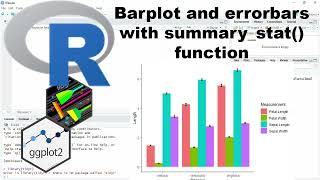
Barplot with error bar using stat summary function, A shortcut
11:23
Introduction to base R plotting system : scatter plot
8:34
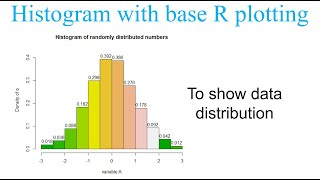
Histogram in base R plotting system
10:52
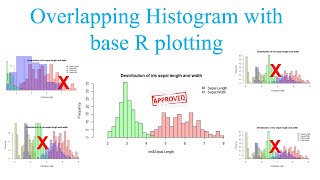
How to plot nice overlapped histograms to compare data in base R plotting?
5:36
Formula interface in R programming: for statistical tests, models and plotting
9:01
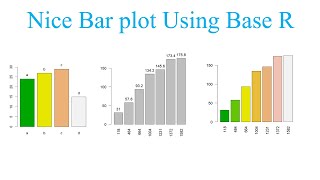
How to make and enahnce nice labeled barplot using base R plotting
13:19
How to make and enhance barplot with data labels, error bar and legend using R programming?
8:59
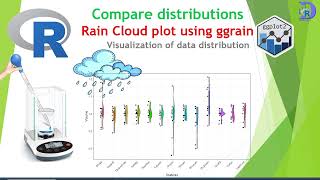
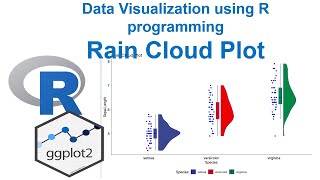
ggplot2: Raincloud plot and its variants by combinations of geoms to visualise distribution
16:00
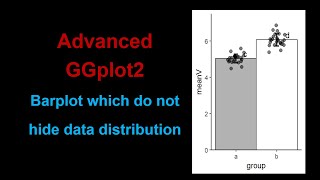
Advanced barplot: Barplot with overlayed points to visualise data distribution
19:23
How to plot barplots similar to those in journal articles using R and ggplot2 and other packages
11:45
How to add citations in R markdown?
11:11
How to write functions in R programming? convert code to function
13:54
Advanced ggplot2: Barplot with highlights : Plot the plots as we see in research Journals
12:59
R programming : Import .csv, xls or xlsx data
8:25
Marginal plots using ggExtra: Advanced ggplot2 Show raw data with its distribution
9:42
Pirate plot: Advanced data visulisation using R , RID plot
7:50
ChatGPT for programming in R : a demonstration of its capabilities
7:15
How to write function in R: for solving Quadratic equation
10:01
How to plot Informative beautiful plots in R: Marginal plots using ggExtra and aplot packages
11:47
customise ggplot using theme() function
12:18
APA style 7th Edition plots using ggplot2
9:49
How to write our own theme in ggplot2
13:46
Mastering Normality Tests in R: Graphical & Statistical Methods | Statistics with R
11:26
How to impute missing data using mice package in R programming
8:18
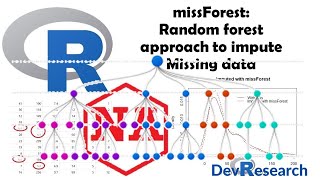
missForest: Imputation of missing data using Random Forest approach in R programming
Barplot with errorbars Using summary_stat() function in ggplot2 and R programming
11:20
Fitting linear regression model and prediction in R programming
10:47
2 Compact letter display(CLD):Two way anova and visualistion using ggplot2
15:31
3 Compact letter display(CLD) three way ANOVA and visualisation with R and ggplot2 part III
10:02
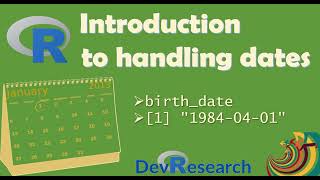
Easy R :Working with dates in R programming: Exploring the as.Date Function and Format Specifiers
ggplot made easy: Time Series Analysis with R and ggplot2
21:21
ggplot made easy: Analyzing Distributions with R and ggplot2
9:07
Ggplot made easy Advanced ggplot for Comparison of Distribution using Rain Cloud Plots in R
Easy Data manipulation From wide to long data with pivot_longer() in R
15:18
Elegant summary tables in R programming: Create elegant publication ready summary tables
48:38
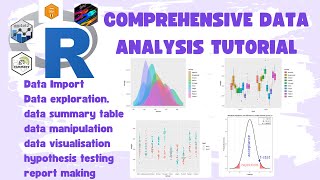
Easy R programming: Analysis of data: import,summary,visualistion.hypothesis testing and reporting
1:19:15
R Programming for Biologists: What R can do : growth rate,Survival Curve, Risk Table Studies & More!
8:51
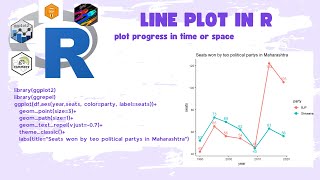
Data Visualization using ggplot2: How to plot progress using line plot
6:50
How to make interactive plot using ggplot2 and plotly?
10:32
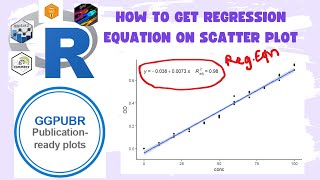
Easy Regression plots in R programming: How to write regression equation on Scatter Plots?
5:20
Understanding Data Distribution: Box Plot explained
5:44
Raincloud Plots with ggrain in R Programming: Amazing and easy visulaistion of Distributions!
27:15
Random Foerst Model Fitting with R's Caret Package: A Complete Tutorial
Mastering Dual Axis Plots in base R plotting : A Step-by-Step Tutorial
18:16
Dual-Axis Plots ggplot2 approach in R: A Step-by-Step Tutorial!
32:12
Learn Neural Networks in R programming: a comprehensive welll explained step by step guide
25:26
Fitting a Neural Network Model on Housing Data with Categorical Variables using R
21:45
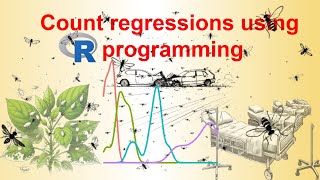
Learn Count Regression Models with R: Poisson, negative binomial, zero inflated and hurdle model
27:31
Master Principal Component Analysis (PCA) in R: Simplifying Complex Datasets
12:26
Understanding the Mann-Whitney U-Test in R: Non-Parametric Comparison of Two Groups
5:09
Start Your R Journey: A step by step guide to install R programming and R stduio