22:31
Barplot using R with error bar, Data Visualization, GGplot2, Plotting data ranking
Rajendra Choure
7:14
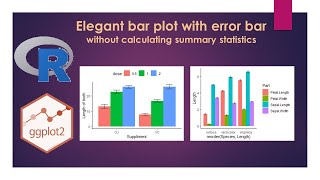
Barplot with error bar using stat summary function, A shortcut
11:37
Customize Bar plot in R -GGplot2- in 5 steps : Beautiful publication ready bar plot
4:33
Bargraph in R , Arrange bars of barplot using R and GGplot2
8:26
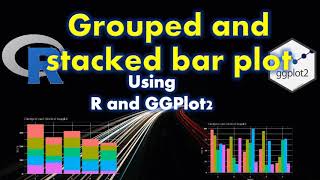
Barplot stacked -grouped Barplot , Data Visualization using R , GGplot2, Plotting part of whole
5:22
Circular bar Plot Data Visualization using R , plotting performance data
9:01
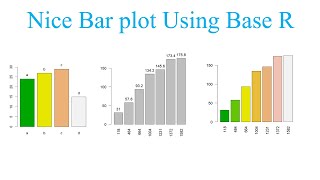
How to make and enahnce nice labeled barplot using base R plotting
13:19
How to make and enhance barplot with data labels, error bar and legend using R programming?
16:00
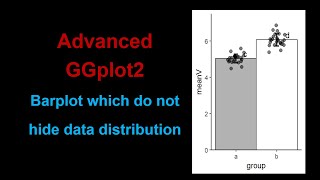
Advanced barplot: Barplot with overlayed points to visualise data distribution
19:23
How to plot barplots similar to those in journal articles using R and ggplot2 and other packages
13:54
Advanced ggplot2: Barplot with highlights : Plot the plots as we see in research Journals
9:42
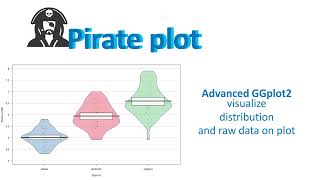
Pirate plot: Advanced data visulisation using R , RID plot
11:47
customise ggplot using theme() function
12:18
APA style 7th Edition plots using ggplot2
9:49
How to write our own theme in ggplot2
9:39
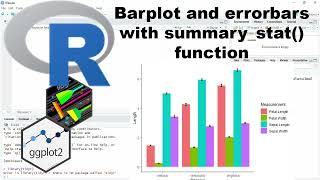
Barplot with errorbars Using summary_stat() function in ggplot2 and R programming
10:47
2 Compact letter display(CLD):Two way anova and visualistion using ggplot2
15:31
3 Compact letter display(CLD) three way ANOVA and visualisation with R and ggplot2 part III
9:07
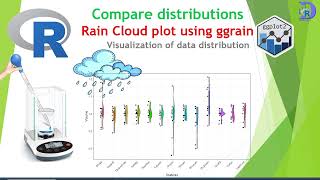
Ggplot made easy Advanced ggplot for Comparison of Distribution using Rain Cloud Plots in R
11:06
Easy Data manipulation From wide to long data with pivot_longer() in R
5:20
Understanding Data Distribution: Box Plot explained