41:49
How to pass Lean Six Sigma Green Belt Exam | 100 MCQs Solved from Simplilearn | Link in description
Abrar Knowledge
9:15
How to calculate Control Limits (LCL & UCL) of U chart |excel & Minitab|SPC Statistic Proces Control
18:24
Converting Non Normal Distribution / Data TO Normal Distribution Data | Using Minitab & Excel
15:16
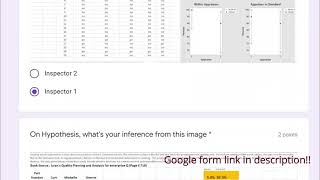
Top 32 Lean Six Sigma Questions & Answers with Google form link in description practice |Mock Exam|
12:56
Attribute Gauge R&R|Attribute Agreement Analysis in Minitab|Illustration with Practical Demo/Example
8:47
I-MR (XmR) Control Chart Vs CUSUM Control Chart using Minitab with real detailed Illustration | HD|
31:54
How to pass Lean Six Sigma Black Belt Exam | 100 MCQs Solved from Simplilearn | Link in description
0:47
Minitab Powerful Functionality "Standardize" #shorts #youtubeshorts
7:51
Gage R&R Study (Crossed): Illustration with Practical Example using Minitab (MSA Study) | Lesson 8|
4:12
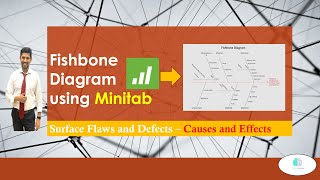
How to Make a Cause and Effect Diagram in Minitab | "Fishbone or "Ishikawa) @MinitabGlobal
8:44
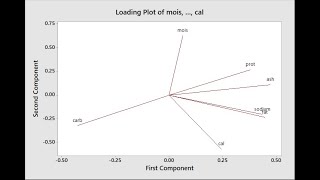
PCA Principle Components Analysis in Minitab
9:16
Multi Variables /Cluster - Dendrogram Graph using Minitab Vs DATAtab |Flat & Hierarchical Clustering
0:59
How to conduct Normality tests for multiple Subgroups in Minitab #shorts #statistics
1:01
Sample Size Calculations for Discrete data #short
7:28
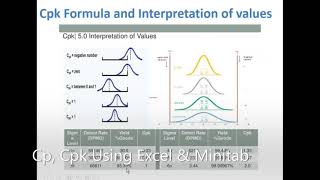
Process Capability is easy! Cp, Cpk using excel and Minitab, Step by Step demonstration with example
8:14
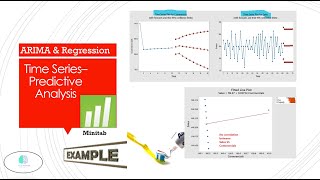
Regression Analysis and Winter's model predictive analysis | Made so simple and easy with Minitab
20:02
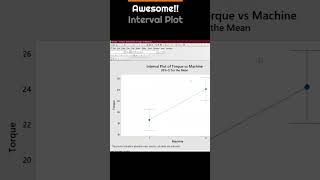
Minitab - Boxplots (multiple Y's) & Creating an interval plot in Minitab | BoxPlot+Interval Plot|HD
9:59
Mann-Whitney or Wilcoxon What's Best for Your Non Parametric Test
How to perform ANOVA in Minitab #statistics #shortsfeed #contentcreator #interval #plot
23:48
Gage R&R Study (Crossed): Illustration with Practical Example using Minitab (MSA Study) | PART 2
13:34
How to calculate Control Limits (LCL & UCL) of P chart |excel & Minitab|SPC Statistic Proces Control
17:49
Creating formula in Minitab|Easy way to learn Minitab|how to create formula & Stat| Minitab ToolKit|
8:13
1 Million random data in 2 Seconds - Minitab | Normal Distribution #minitab #mustwatch #datascience
MSA - AAA Attribute Agreement Analysis @MinitabGlobal #shots #reels #ytshorts
11:08
How to calculate Cp and Cpk using Minitab Formula|Part 2 |Process Capability study|step by step demo
20:25
Learn in easy way 'Vlookup' function In Excel and Minitab |Merge worksheets in Minitab | LSS # 33
19:17
Control Chart- Attribute charts (C & U charts, NP and P charts for Defectives) using Minitab, Part2
32:33
Interview on Lean Six Sigma | 10 Most Common Questions Answered| @AbrarKnowledge with Adnan Ahmed
0:56
DoE Design Of Experiments short | B2A Basic to Advance Level| #minitab #shorts #Taguchi
3:53
Pareto Chart compare with Power BI Vs Minitab Vs Excel in 3 mins #powerbidashboard
18:46
Attribute Gauge R&R|Attribute Agreement Analysis in Minitab|Illustration with Practical Demo- Part 2
5:15
Covariances & Correlation using Minitab Vs DATAtab |Pearson Method, P value | Unbelievably Easy| HD|
11:31
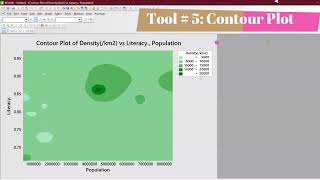
Visualizing Multi-Variable Functions with Contour Plot and Bubble Plot|Step by step demo in Minitab|
11:50
DoE : Design Of Experiments | Easy way to learn DoE with Minitab Working #doe #sixsigma
How to convert Number to Text in Minitab software
Time Series ARIMA & Regression analysis in Minitab | FREE SAMPLE | #illustration #minitab
22:51
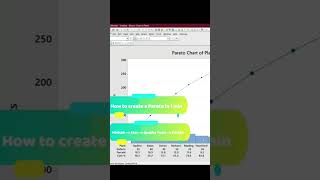
Pareto Chart Tutorial using 3 Tools comparatively [ Power BI Vs Minitab Vs Excel ] Tutorials
How to calculate Sample size for variable data in Minitab #shorts
15:56
Calculating StDev(within) & StDev(Overall) in Excel | Process capability Cp, Cpk, Pp, Ppk, Cpm
0:57
Quiz on control chart variable with FREE link to practice #shorts #surveymonkey
14:24
Six Sigma - XBar-R Chart |Mean&Range| using excel and Minitab, Control Chart Continous data|X bar-R|
Pareto using Minitab #1minutevideo #shorts #youtubeviralshorts
1:29
Pareto in Minitab Vs DATAtab | In just 90 Seconds | Nice comparison |@MinitabGlobal
7:27
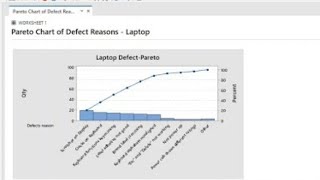
How to create a `Pareto Chart' in Excel & Minitab - |80/20 Rule or Pareto Principle| with example
30:32
Lets learn Minitab-Transpose, Delimit, Recode, IF logic set up & calculation func| Lean 6 sigma #45|
16:12
Let's learn Minitab-Tips & Tricks |Minitab Layout, Minitab Shortcuts & How to change default setting
2 Sample T tests Vs Paired T Tests in Minitab #examresults #minitab #sixsigma
5:31
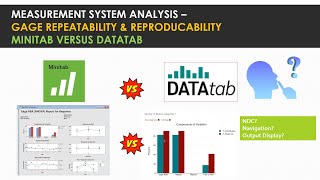
Compare Gage R&R Study (Crossed) display OUTPUT using Minitab Vs DATAtab(MSA Study) | NDC value |HD|
10:29
26 Questions related to Minitab solved LIVE | Simplilearn - Minitab-exam-question-free-practice-test
0:53
Binomial Process Capability using Minitab #shorts #ytshorts #youtubeviralshorts
1:00
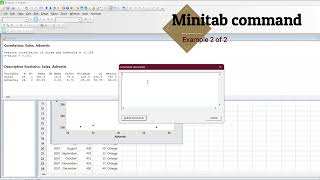
Minitab command Part 1 | can fetch stat value in less than 5 seconds | #statistics #shorts
How to convert Number to Text in Minitab software #short
12:29
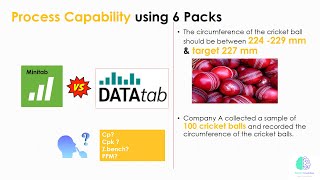
Minitab Vs DATAtab on Process Capability Tutorials |Cp, Cpk, Z.bench| Comparison | Easily Explained
0:52
StatGuide in Minitab #PowerfulFeatures #Minitab #Hack #1 #shorts
How to calculate Sample Size for 2 Sample T tests in Minitab #shorts #ytshorts
16:52
Comparison of Proportions (p-chart) Vs Laney P charts Vs Diagnostic P | using Minitab & Excel |HD|
1:40
What Happens When You Compare DPMO and PPM in 100 Seconds? #minitab
11:17
Minitab Quiz Part 1 | Very useful on Minitab Navigation and Choosing the right tool for the analysis
2:07
How to create Marginal Plot in Minitab|Marginal Plot gives Scatter with Histrogram,Boxplot & Dotplot
15:47
Minitab Quiz Part 2 &3|Pick up the links from Description for your Practice|Lean Six Sigma Lesson#27
6:34
Lean Six Sigma Mock Exam Part 6 of 10 in 6 Minutes |Analyze Phase DMAIC | Pareto,Hypothesis,FMEA| HD
16:38
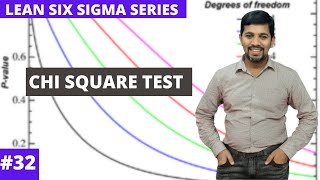
Simple Explanation of Chi-Squared| Illustrated with examples & Using Minitab #chisquaretests
23:33
Binomial Capability Analysis Vs p chart Illustration with Practical Example using Minitab | HD
26:45
Statistics - Scatter diagram, Regression and Correlations | Demo using Minitab with 2 examples| #34
7:34
Is #virat is better than #sachin ? Statistics made easy! |Hypothesis-t-test Minitab| #trending
14:08
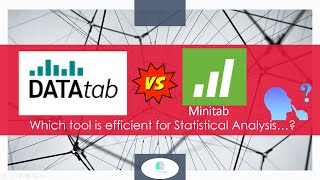
DATAtab Vs Minitab |Comparison, Application and Output Display| Statistics Data -Lean Six Sigma |HD|
12:03
Run Chart Vs Control Chart using Minitab |Step by step demonstration | Lean Six Sigma lesson # 39
2 Sample T test Vs ANOVA #MSsway #shorts #sway
7:59
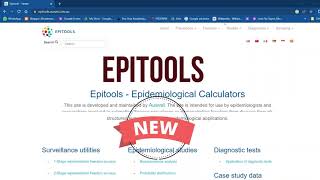
Epitools - Epidemiological Calculators | Chi Sq and Sample test with Epitools Vs Minitab
15:26
Skewness And Kurtosis And Moments | What Is Skewness And Kurtosis? | Statistics | Excel and Minitab
8:01
How to find whether data is normally distributed|compare-Distribution Analyzer Vs Minitab Vs DATAtab
Quiz on Control Chart #qualitycontrol #shorts #ytshorts #surveymonkey
How to calculate Kurtosis in Excel #shortsviral #shorts #exceltips
14:17
Minitab on MSSD (Mean Square of Successive Differences) and Interquartile (1st and 3rd Quartile)
9:57
F Test Hypothesis testing in Minitab | #statistics #minitab #freesamples | Part 2 |
17:46
u chart Vs Process Capability Poisson Distribution | Illustration with 2 simple examples #minitab
9:30
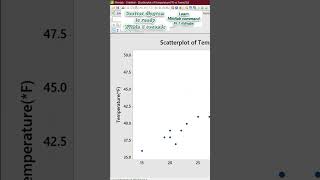
Minitab using command #scatter #correlation #descriptivestatistics
Minitab Sub command Part 2 | can fetch plots /graphs in less than 5 seconds | #statistics #shorts
How to combine or Overlaid multiple subgroups in a single Histogram 🔔 @MinitabGlobal #ytshorts
How to perform Regression in Minitab #statistics #shorts
0:51
Update graph 📊 automatically in Minitab #shots #shortsviral #minitab #mustwatch #automatic
DoE Design Of Experiments short version
0:58
How to generate random Binomial Data with p chart #shorts @MinitabGlobal
5 QA on Minitab #quiztime #shorts
100 + FREE Minitab Practice dataset within Minitab @MinitabGlobal #shorts
10:15
Master Microsoft Excel in 30 Days with Data Analysis ToolPak Challenge
How to unstake the data in Minitab #shorts #youtubeviralshorts
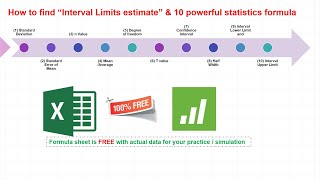
How To Calculate Confidence Intervals In Excel and Minitab | Learn 10 Statistics formula easily| HD|
19:22
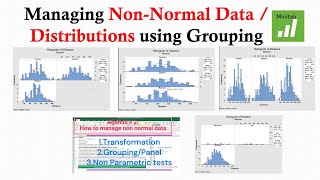
Managing Non Normal Data / Distributions using Grouping / Paneling | Minitab FREE files #statistics
How to plot the bubble chart in Minitab #shots #minitab
15:22
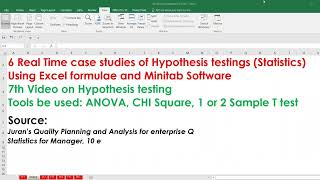
6 hypothesis testing statistics real time case studies | ANOVA, chi Square| testing of hypothesis
3:31
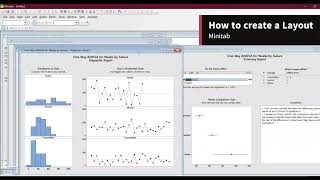
Minitab Tips and Tricks: Creating a Layout of graphs /Plots in Minitab | Informative Video
10:36
Process Capability made simple | White board Illustration in detail| Cp, Cpk, Pp, PPk | DPMO, PPM
10:04
How To Calculate Confidence Intervals In Excel and Minitab | Part - 2 | with 5 Powerful examples
7:26
How to Draw 3D Surface Plot using Minitab Software | 3D Surface Plot Vs 3D Wire Frame
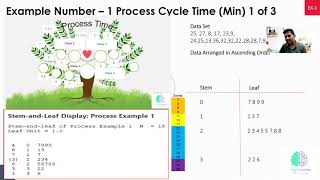
26:02
How to Create Stem and Leaf Plot With 2 Easy Examples & Real Time Illustration using Minitab & 3 Qs!
7:04
Lean Six Sigma Mock Exam with Free certificate Part 5 of 10, Measure Phase |SPC, MSA, Cp, Cpk, Zst|
8:57
Lean Six Sigma mock exam 1 of 10 | What is Lean Six Sigma| Simple 10 questions| e-certificate free|
21:49
Model question paper for Green/Black Belt Lean Six Sigma Prof| Link in description| Free Certificate
7:37
How does LSS [Lean Six Sigma] help to Improve Quality and Organizatonal Performance |What is LSS|
16:41
Highly useful Minitab Tool Navigation I Control chart, GRR, Calc, DoE etc I - Lean 6σ Lesson 42
14:27
Simplilearn Minitab Course - 27 Questions answered
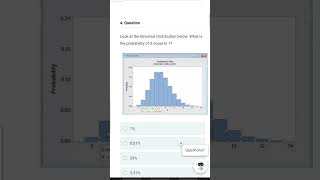
Probability Plot of Normal Distribution #shorts #knowledgeispower #motorcycle #minitab
13:14
Variable Control Chart (SPC) - 3 FREE Case studies - Available directly in Minitab in just 13Minute
12:15
Equivalence test Vs ANOVA | FREE Minitab Exercise | 2x2 Crossover Design Equivalence Test
18:08
Minitab Descriptive Statistics | with real time example | Practical demo using Minitab, LSS # 43
Marginal Plot with BoxPlot Combo in Minitab #shorts
11:32
How to pass Six Sigma Green /Black Belt Exam | 15 MCQs Solved from mometrix | Link in description
9:26
3 Variable Control Charts and 4 Attribute Control Charts made easy | SPC with latest guidelines
10:02
ANOVA in Excel Just 10 seconds - FREE Excel Add-ins | 2 case studies results & compare Minitab
12:59
Design of Experiments DOE -| Part 6 | with FREE certificate | Link in description | #doe
Before / After Improvement comparison using control chart IMR in Minitab #leansixsigma #minitab
37:51
7 Type of Control Charts using Minitab - Master all control charts in 37 Minutes #illustration
11:41
One way ANOVA using Minitab Vs @datatab #leansixsigma
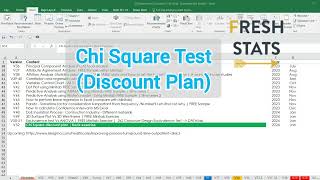
Chi Square Test for Discount plan using Minitab | Chi Sq Test #shots #viralshort @MinitabGlobal
8:15
Let's memorize more than 100 terms of Business STATISTICS in Alphabetical order | Useful video
14:48
Before / After Improvement comparison using PROCESS CAPABILITY in Minitab #leansixsigma #minitab
8:32
How to create a Pareto Diagram with Minitab - Why factor is important than frequency #minitab
10:00
2 Real Time Examples of Hypothesis using Minitab | Materials are sharable|Book review: Juran's | HD|
4:30
Parametric and Nonparametric Tests | Six Sigma Handbook 4e | Book review
12:53
Minitab - Spot The Error, Statistics-Type of data |Lean Six Sigma Mock Exam Part 4 of 10| HD |Useful
FREE Example of Attribute Agreement Analysis - #msa #leansixsigma
6:13
How to create X bar R Chart and Histogram / Bellcurve in MS excel #exceltutorial #statistics
7:33
Pareto Chart using Minitab Vs DATAtab along with other 4 Plots | Useful| @datatab @MinitabGlobal
15:06
Minitab Vs DATAtab | Scatter Vs Regression | Add a Categorical Variable to a Scatter plot | USEFUL
8:59
ANOVA Vs 2-sample T-test: An Easy Example | Minitab Vs DATAtab | Chapter Enable
4:47
DOE Design of Experiments | Taguchi Model | Part 3 #doe #sixsigma #minitab
Top 30 Lean Six Sigma Green/Black QA with Google form link in description practice |Mock Exam| HD
18:49
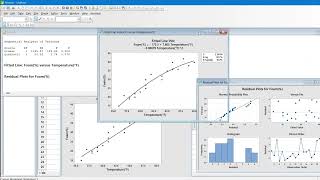
Design of Experiments DOE Construction Examples | DOE in Minitab | A complete Illustration
15:52
Chi-squared test in Excel | 3 Live examples and Demo #chisquaretest #exceltips
16:08
Learn DOE in 15 minutes with simple example | Factors for Impactful communication
12:08
DoE : Design Of Experiments | Easy way to learn DoE with Minitab Working Part 2 #doe
18:55
F Test Vs Z test Vs T test Hypothesis testing in Minitab #statistics #freesamples | Part Final
18:23
Design of Experiments DOE - 2 Examples | Part 5 | with FREE certificate | Link in description | HD |
10:53
What is Hypothesis in Stat Context |if p value is low, then Ho must go! |Core Statistics made simple
12:28
Regression Analysis with 3 examples | Illustrated with 2 examples |Linear, Quartic & Cubic explained
9:22
Scatter / Regression using Excel Vs Minitab Vs DATAtab comparison with 3 examples | HD
9:37
Multiple Regression, Clearly Explained !!! using Minitab Vs DATAtab | VIF, R Sq| @datatab
16:39
Binomial Distribution | Probability & Distribution | Using Excel Formula / Add-ins and Minitab| Book
22:56
Chi-squared test using Excel formula | 5 Live examples and Demo| Using Excel compared with Minitab
16:50
Regression in Excel and Minitab in 16 Mins | Linear, Quadratic and Cubic with Log | MUST WATCH
18:20
Practical Illustration of 10 Powerful Statistics Tools using Minitab #illustration #minitab #Chapter
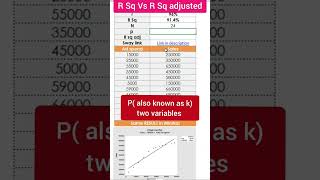
R Square Vs R Square Adjusted Calculation In Excel #businessstatistics #withsubtitles
Winters' model - Time Series | Water Consumption Vs Electrical Charges #illustration
6:47
Mock Exam -Lean Six Sigma -Part 9 of 10 in 6 Minutes | Analyze Phase|Hypothesis, Regression, Scatter
11:30
How to plot the scatter plot in excel and compare result in Minitab |#illustration #msexcel #minitab
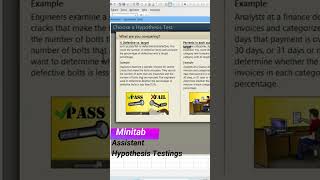
Minitab Assistant Menu - Hypothesis testing #minitab #hypothesistesting #shorts
3:28
Minitab Navigations- 30 common Lean Six Sigma Tool & their navigations @MinitabGlobalFREE drivelink
12:39
Mindmap for Scatter & Regression | Xmind, MindMap, Minitab| 3 Case studies and illustration |
Minitab Glossary | one place for A-Z learning of statistics
DOT Plot In Minitab 🔥 #visualization #shorts
6:56
Interval Plot & Probability Plot | Minitab Vs DATAtab | @MinitabGlobal @datatab
12:49
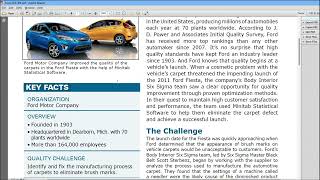
Success story of Ford Motor fiesta : DoE Minitab #sixsigma #illustration #mustwatch
6:20
How To Create DotPlot in Minitab | 2 FREE samples #illustration #minitab
5:20
Olympics 2024 : using 2000 year data - Predicted accurately 2024 result! #regression #exceltutorial
14:50
9:38
Why Regression analysis is trickier in Excel #illustration #regression #microsoftexcel #exceltips
3:25
T Test Hypothesis testing in Minitab | #statistics #minitab #freesamples | Part 4
Chi Square Test for Discount plan using Minitab | Chi Sq Test #illustration
3:56
Scatter Plot With Connect Line #statistics #leansixsigma #illustration #stepbysteptutorial
5:33
Z Test Hypothesis testing in Minitab | #statistics #minitab #freesamples | Part 3